Customers

Results, measured honestly

Field service software marketing is full of numbers nobody can trace. Here's how we measure what Homer actually changes in a business — and what we'll publish only once a customer has verified it.

Note for the AE team: the three studies below are format samples, not real customers. They show the structure a finished case study should take. Replace them with verified, customer-approved results before launch, and delete this banner. Nothing on this page should go live as a factual claim.
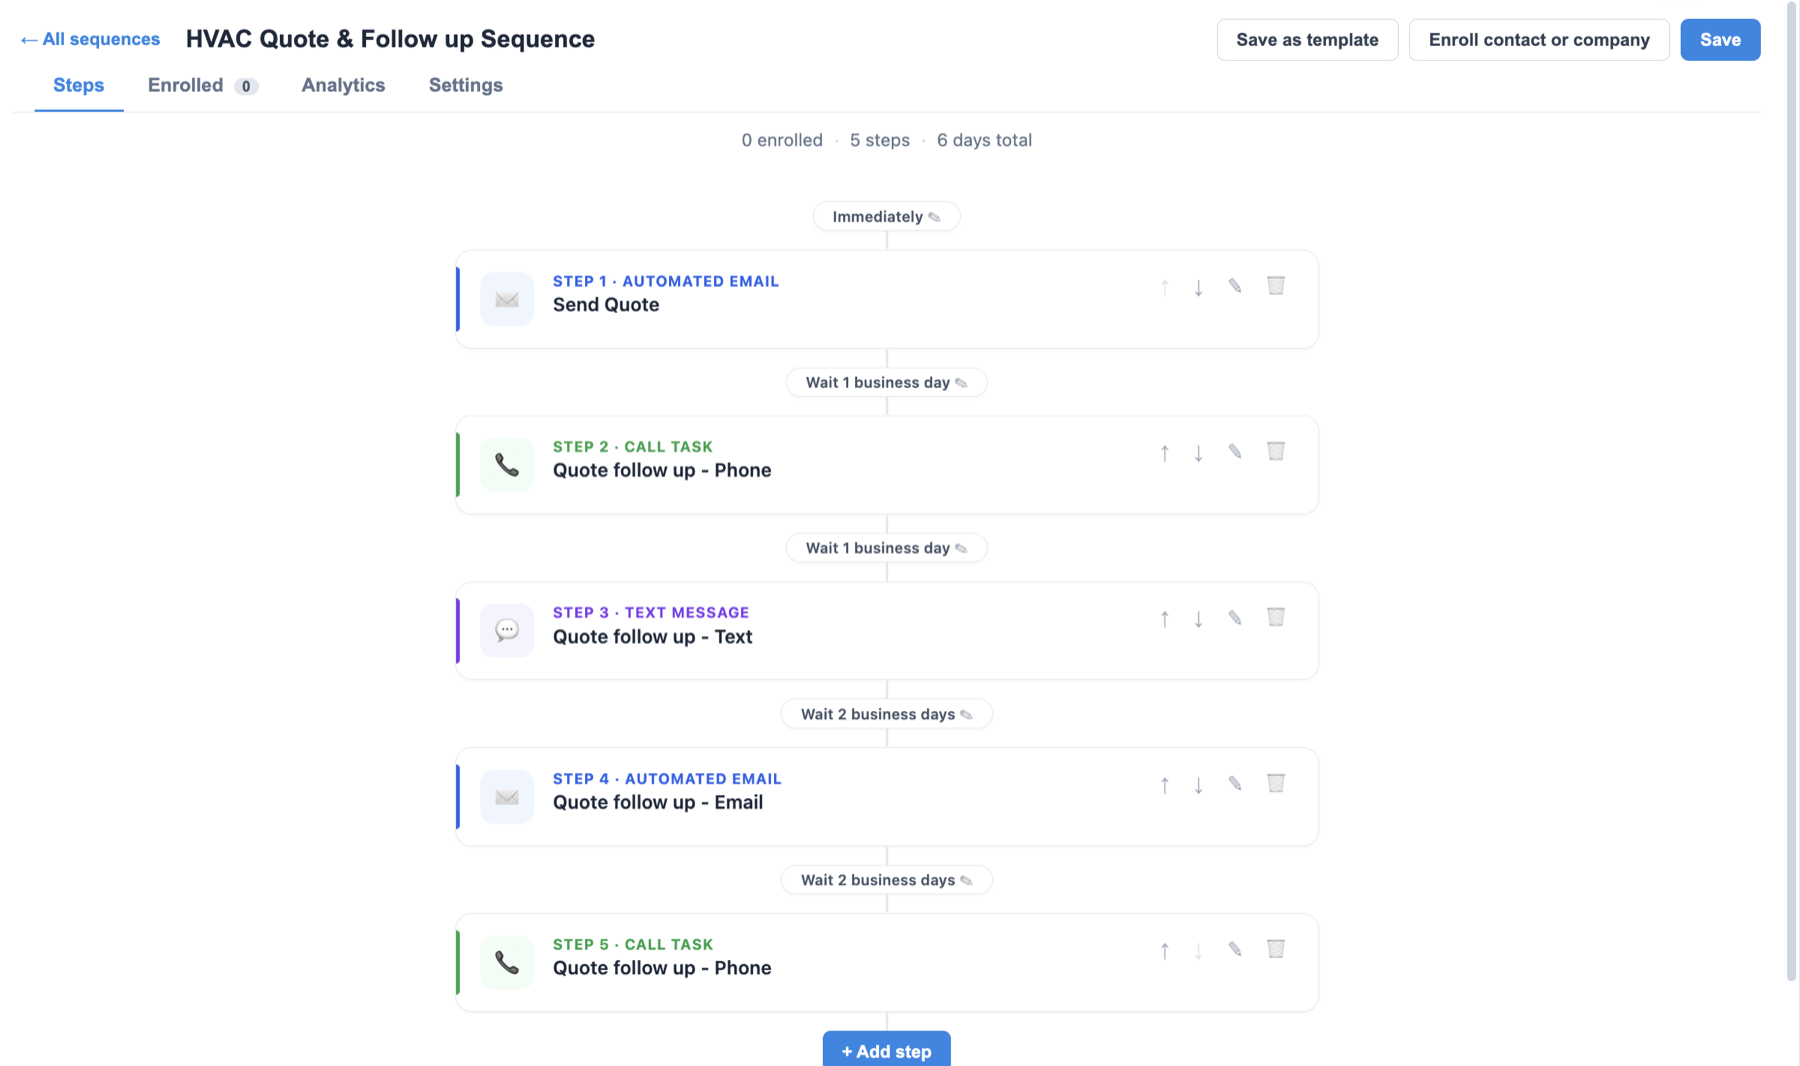
HVAC · 6 trucks

After-hours calls stopped going to voicemail

Before: Calls after 5pm rolled to an answering service that took a message. Roughly a third of those callers booked with someone else overnight.

After: Homer answers, qualifies, and books into the live schedule. The morning board already contains last night's emergencies.

Metric to report: after-hours booking rate, before vs. after.

Plumbing · 12 trucks

A dispatcher's morning went from 90 minutes to 15

Before: One person built the board by hand every morning, then spent the day rebuilding it as jobs ran long.

After: The board is drafted overnight. The dispatcher reviews flagged exceptions and spends the rest of the day on customers instead of the calendar.

Metric to report: dispatcher hours on scheduling per week; drive time per job.

Electrical · 3 trucks

Estimates presented on site instead of emailed tomorrow

Before: Techs took notes, the office built the quote that evening, and it went out the next day — by which time the customer had two other bids.

After: Options are drafted from the tech's spoken findings and presented before they leave.

Metric to report: time from diagnosis to quote delivered; estimate close rate.

Our method

What we baseline before you switch

You can't claim an improvement without knowing where you started. Before go-live we capture these from your existing system, and we report against them at 30, 90, and 180 days.

Call capture

Inbound call volume, answer rate, abandoned calls, and how many of them ever became a booked job — split by hour of day.

Schedule efficiency

Jobs per truck per day, drive time per job, first-time fix rate, and how often a window is missed.

Sales conversion

Average ticket, estimate close rate, time from diagnosis to quote, and the value of deferred work that never came back.

Cash cycle

Days from job complete to invoice sent, invoice to payment received, and total receivables over 30 days.

Admin load

Office hours spent on scheduling, job write-ups, invoicing, and collections — the headcount question owners actually care about.

Customer experience

Review volume and rating, on-time arrival rate, and how often a customer had to call to ask where the tech is.

Our policy

We don't publish a number a customer hasn't signed off

Every figure on this site that describes a real business will name the company, the period it covers, and how it was measured — or it won't be here at all. If you want to talk to someone running Homer today rather than read a testimonial, ask us and we'll make the introduction.